
Weekend Crowds and TV Ratings – April 13-17, 2023
A round up of the crowds and television ratings from the AFL, NRL, A-league, and Superleague (UK). Most of this has been previously published by us on twitter (@footyindustryAU).
AFL
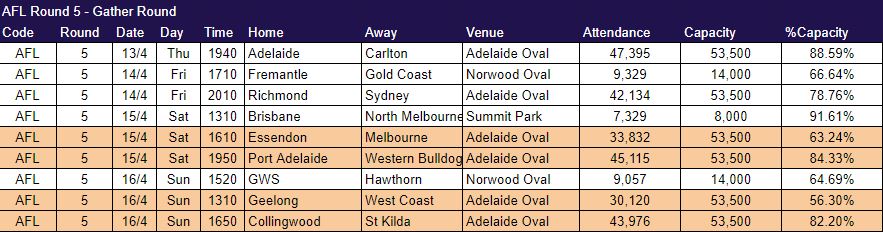
Gather Round #AFLcrowds were 204,335 over 9 matches at an average of 22,704 (or over 7 fixtures @ 29,191) This would be the lowest round 5 total since R5, 1993 with the lowest round average since 1993 (or 1995 on fixture basis). The lowest aggregate crowd in the 9 game era.
Gather Round puts an end to the record #AFLcrowds run for the season start with aggregate crowds running to 1,687,267 at an average of 37,495 for the season (or 39,239 on a fixture basis). This is the 4th best start in the leagues history, with the 9th best ave (3rd by fixture)
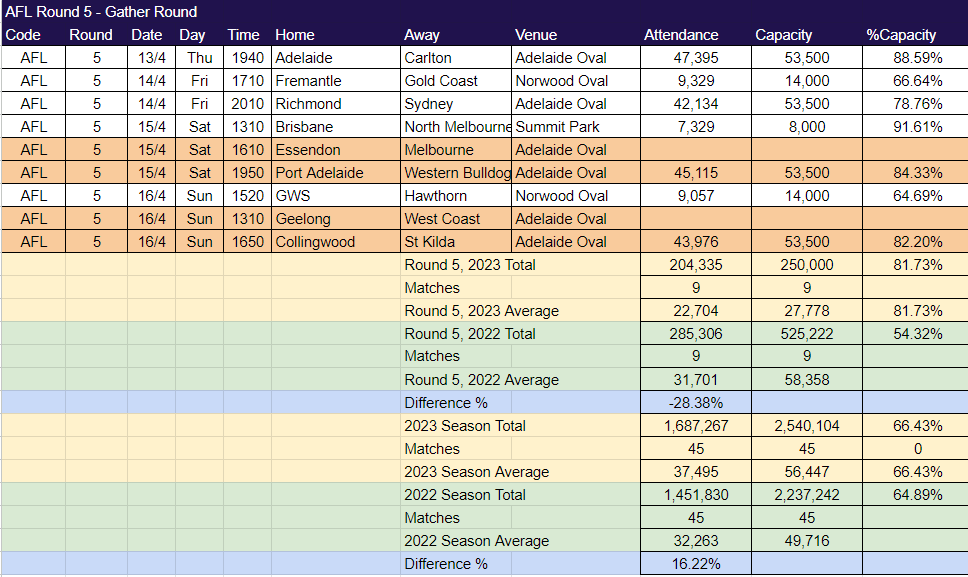
The AFL has provided crowd data for the other two Adelaide oval matches implying that total per match #AFLcrowds was 268,287 at an average of 29,810 per match.
Round 5 Preliminary #AFLtvratings Total came in at 5.239m. This was 2nd highest round for the year behind the season opening round and the Highest rating Foxtel overnight audience for the AFL in 2023.
Friday nights Tigers/Swans fixture was the number 1 rated with 1.2m viewers across Seven and Fox while Thursday nights Crows/Blues also topped the million audience mark. The Pies/Saints Foxtel exclusive match was the best drawing game on the paytv broadcaster with 292,000 viewers.
According to Seven
- Seven’s AFL Friday Night Football: #1 sport program of the week, 650,000 viewers nationally.
- Seven’s AFL Thursday Night Football: #2 sport program of the week, 612,000 viewers nationally.
- Seven’s AFL Saturday Night Football: #3 sport program of the week, 549,000 viewers nationally.
To R4, #AFltvratings are down less than 1% on 2022 with 21m viewers over R1-4 at 591k per match.
[Syd -16% Melb -7.8% Bri +4.2% Adl +1.3% Per -15% Syd/Bris +5.8 Metro -4.2% Reg +4.6% FTA -6.35% 7 B’cast +4.8% Fox STB +12.1%]
A-league Mens
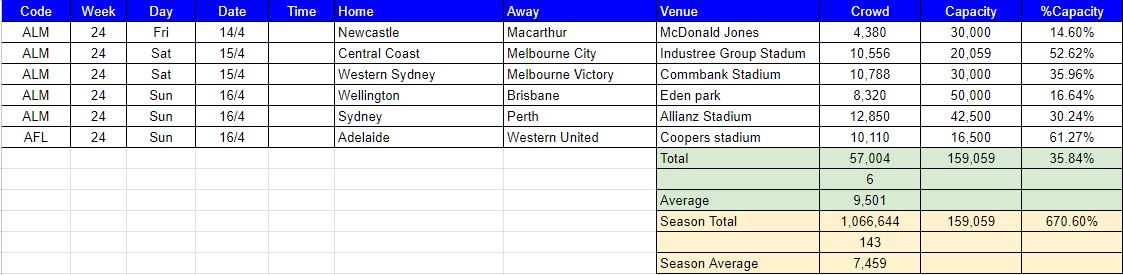
Round 24 #ALMcrowds came to 57,004 at an average of 9,501 per match. So far this season 1.066m people have attended, just 6,665 short of the full season figure for 2019-20 (at a lower average) and the first time its hit a million attendance since that year.
NBA
On Saturday morning, 31,000 tuned into ESPN the Timberwolves take on the Thunder on subscription television, while on Sunday morning, 39,000 watched the Kings take on the Warriors
NRL
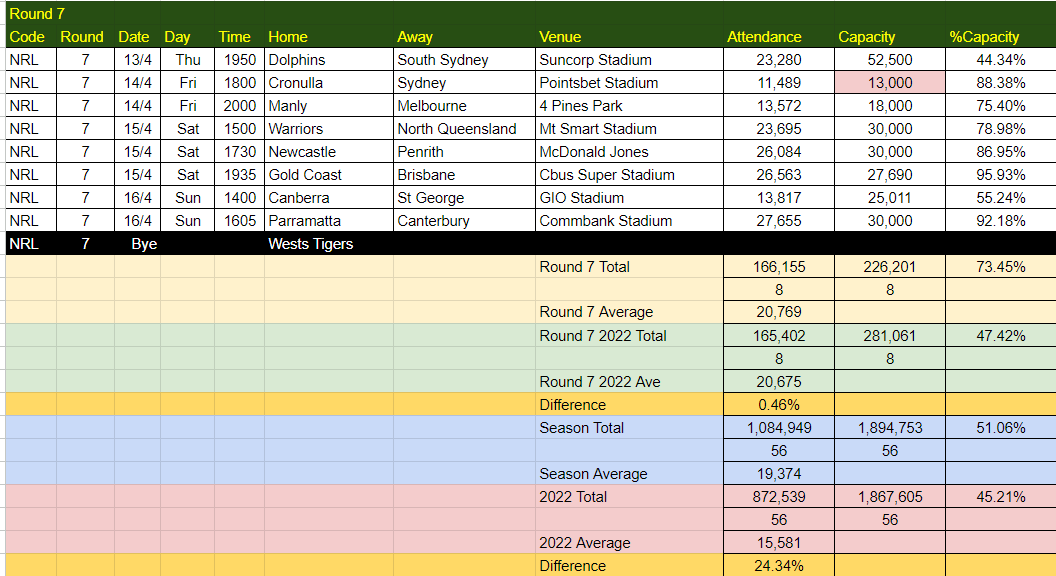
Round 7 #NRLcrowds were 166,155 at an average of 20,769 – only the 4th time this has been done and on par with 2022. This was the 2rd best R7 attendance for the NRL, behind 2017 and 2014.
NRL R1-7 continues its record breaking march through the start of the season now reaching 1.084m at an average of 19,373. This is only the second season to have reached 1m by this time, after 2013, and the only season to have over 19,000 per game.
Round 7 Preliminary #NRLtvratings were 5.489m. This is the 4th highest preliminary round rating for the year.
The Dolphins continue to rate well, with Thursday nights clash against Souths drawing in over 1.2m viewers across Nine and Fox, while Friday nights Storm/Sea Eagles game also rated over a million viewers.
Saturday nights Fox exlusive Broncos/Titans game was the best rating game on Fox with 327,000 viewers.
Round 6 Total TV and consolidated Foxtel viewing had a total estmated viewing of 6.057m for the weekend at an average of 780,000 viewers per match. This is just the second round of the season to pass 6 million viewers. So far this season more than 35 million viewers are believed to have watched the NRL on television or streaming at an average of 731,000 per match.
,Ratings are up 15%, Nines FTA ratings are up 10% on 2022 led by Brisbane which is up 21% on 2022.
[Syd -1.36%, Mel +11.96%, Bris +21.24%, Adl -6.85%, Per -15.44%, Mel/Adl/Per -1.22%, Metro +5.93%, Regional +6.25%, BVOD +78.53%, Total TV +10.11%, Foxtel STB +23%, Kayo est + 8.56%]
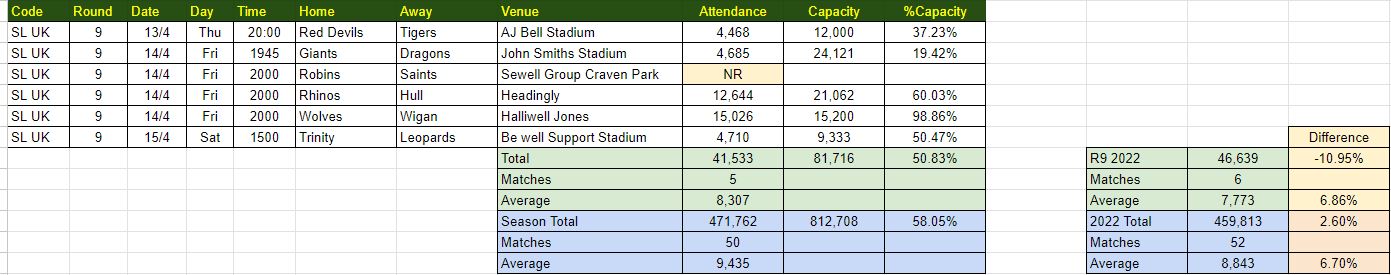
Superleague (UK)
Round 9 #SuperLeagueCrowds came to more than 41,533 at an average of 8,307 per match (with SG Craven Park still to report). These figures are down 11% on aggregate, but up 7% on average. To date the season has seen more than 471,000 attend at an average of 9,435. (+7% YoY)
Data Sources
- Overnight and Total TV ratings for Australian sports are sourced from Oztam Preliminary Overnght, Total TV and subscription TV consolidated+7 reports. Streaming is estimated based on reported trend data, although this has been severely limited this season.
- Attendance data is from league websites, although this is also checked against data at Austadiums.com and afltables.com.
- Capacity data is from Austadiums for Australian and New Zealand sites, and wikipedia for Superleague
- For corrections, typos or oversights please feel free to reach out to us on twitter via dm, or email us at jmlassey@gmail.com